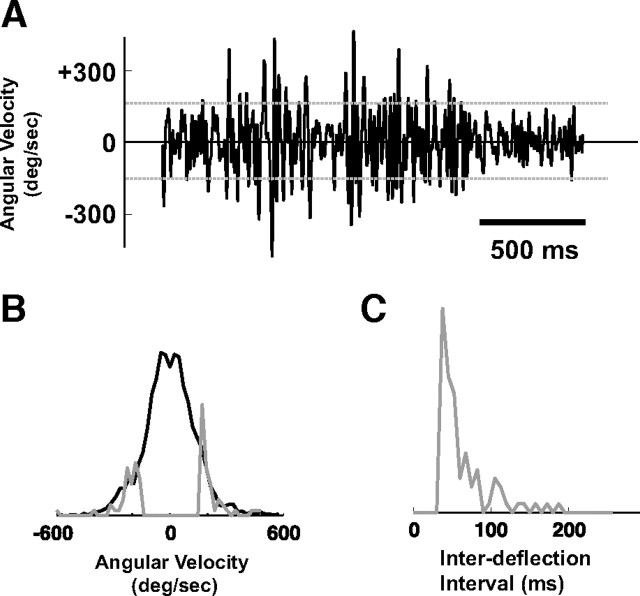
Figure 4.
Design of stimulus deflection sequence from behavioral observations. A, Instantaneous velocity of a single vibrissa in contact with a coarse texture (36 grit sandpaper), as measured through high-speed videography (Jenks et al., 2010)—see Materials and Methods. The horizontal dashed gray lines represent a threshold imposed at ±160°/s, to restrict transient stimulus events to a velocity range within which the cortical neurons tend to be sensitive. B, The full distribution of instantaneous angular velocities (black). The gray curve represents the distribution excluding transient deflections below the threshold in A, and excluding those with interdeflection intervals less than 40 ms. Both distributions have unit area, but have been scaled for comparison of tails. C, Histogram of the observed interdeflection intervals, excluding those below 40 ms.

