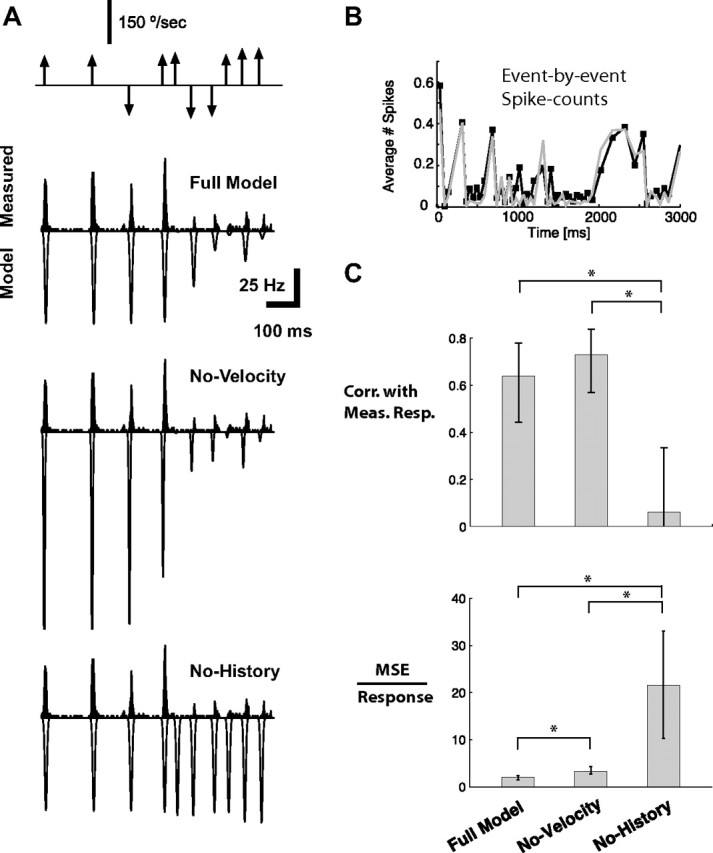
Figure 5.

Model prediction of cortical activity. A, The top shows the sequence of vibrissa deflections, where the magnitude reflects the angular speed and the direction of the arrow reflects the direction in the rostral–caudal plane. Below is the measured PSTH in response to this stimulus sequence (black; averaged over n = 6 cells with similar time course of CTR; binned at 2 ms), along with the corresponding predicted (inverted scale) firing rates, for the Full Model (top), the model without taking into account velocity tuning (No-Velocity), and the model without taking into account history dependence (No-History). Localized Gaussian templates of the PSTH events were used for the plotting of the predicted response events, with the appropriate spike count, latency, and jitter as predicted by the encoding model. B, A comparison of the event-by-event spike count of the measured data (black) and the Full Model prediction (gray). The error bars for measured spike counts were not included for clarity, but show that all predictions are within the confidence band of the measurements. C, Model performance across the larger sample of cells (n = 15). The top plot shows the correlation coefficients between various model predictions and the measured responses (binned at 30 ms) for the Full Model, for the case in which velocity dependence is neglected (No-Velocity), and for the case in which history dependence is neglected (No-History). The bottom plot shows the magnitude of the MSE relative to the size of the neural response for the same model conditions as the top plots. All error bars represent the SEM (* indicates statistical significance at the level of p < 0.05).
