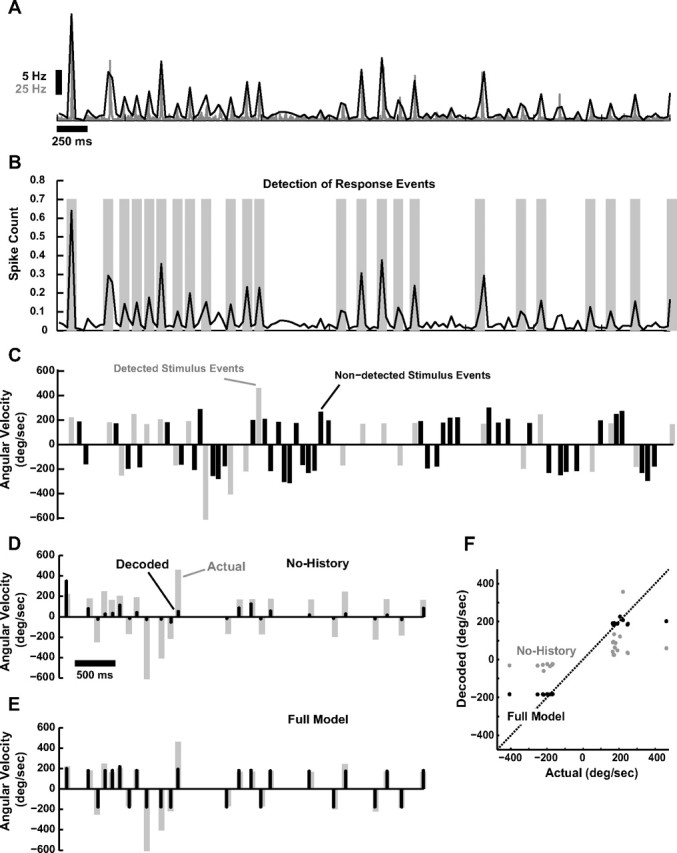
Figure 6.

Bayesian decoding of tactile patterns. A, Average PSTH (gray, 2 ms bin size, n = 6 cortical neurons) and corresponding running estimate of local spike-count in a 30 ms bin (black). B, Response events were detected based on optimal Neyman–Pearson criterion (see Materials and Methods). Detected events are highlighted with gray bars. C, Shown is the corresponding sequence of deflections of varying angular velocity and timing. Stimulus events are parsed into those that correspond to detectable events in the cortical activity (gray) and those that result in an undetectable level of cortical activity (black), which are thus not predictable in the decoding process. D, Actual stimulus events that were detectable from the cortical response (gray), along with the corresponding decoded velocities (black) when only velocity tuning, and not history dependence, is taken into account (No-History). E, Actual stimulus events that were detectable from the cortical response (gray), along with the corresponding decoded velocities (black) for the Full Model. F, Actual versus predicted stimulus event velocities for the No-History (gray) and the Full Model (black). Dashed line is unity line.
