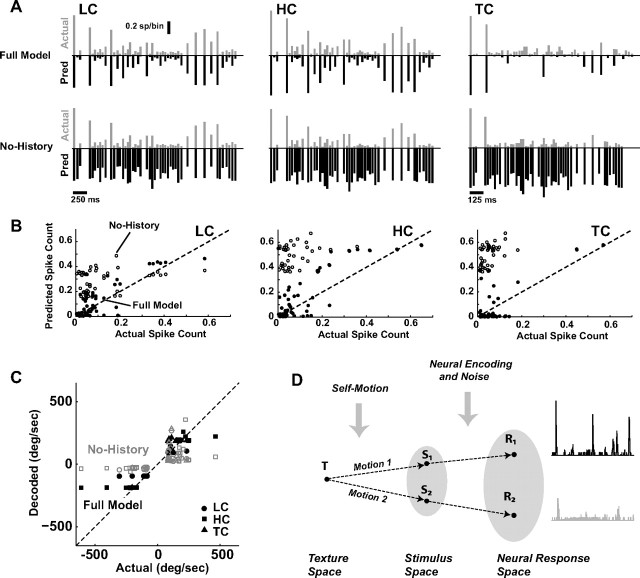
Figure 8.
Encoding and decoding under stimulus transformations. A, The average actual (gray, positive axis) versus predicted (black, inverted axis) cortical response to the LC (left), HC (middle), and TC (right) stimuli, for the Full Model (top row) and the No-History case (bottom row). Note that the LC and HC have a different time scale as compared to the TC case. For this example, the velocity scaling from LC to HC was a factor of 2, while the temporal scaling from LC to TC was a compression by a factor of 2. The actual response was an average across a subgroup (n = 15 cortical neurons). B, The actual versus predicted event-by-event spike counts for the LC, HC, and TC stimuli. The model predictions were again conducted for the Full Model (filled symbol) and the model with the nonlinear, suppressive history term removed (No-History, open symbol). Correlation coefficient between actual and predicted response: Full Model, LC: 0.86, HC: 0.83, TC: 0.81; No-History, LC: 0.27, HC: 0.27, TC: 0.35. C, Actual versus decoded event-by-event angular velocity for the LC (circle), HC (square), and TC (triangle) stimuli. The Bayesian decoding was performed using the Full Model (filled symbols) and the model with the nonlinear, suppressive history term removed (No-History, open symbols). Correlation coefficient between actual and decoded angular velocity: Full Model, LC: 0.91, HC: 0.92, TC: 0.91; No-History, LC: 0.66, HC: 0.62, TC: 0.62. D, When the vibrissae engage a single surface/texture T, variations in the behavior/motion result in different sensory inputs to the pathway (S1 and S2 here), resulting in different patterns of cortical activity (R1 and R2). Conceptually, knowledge of the encoding properties of the pathway and knowledge of self-motion allow an observer of the cortical activity to infer invariant properties of the surface, despite variations in the neural response.

