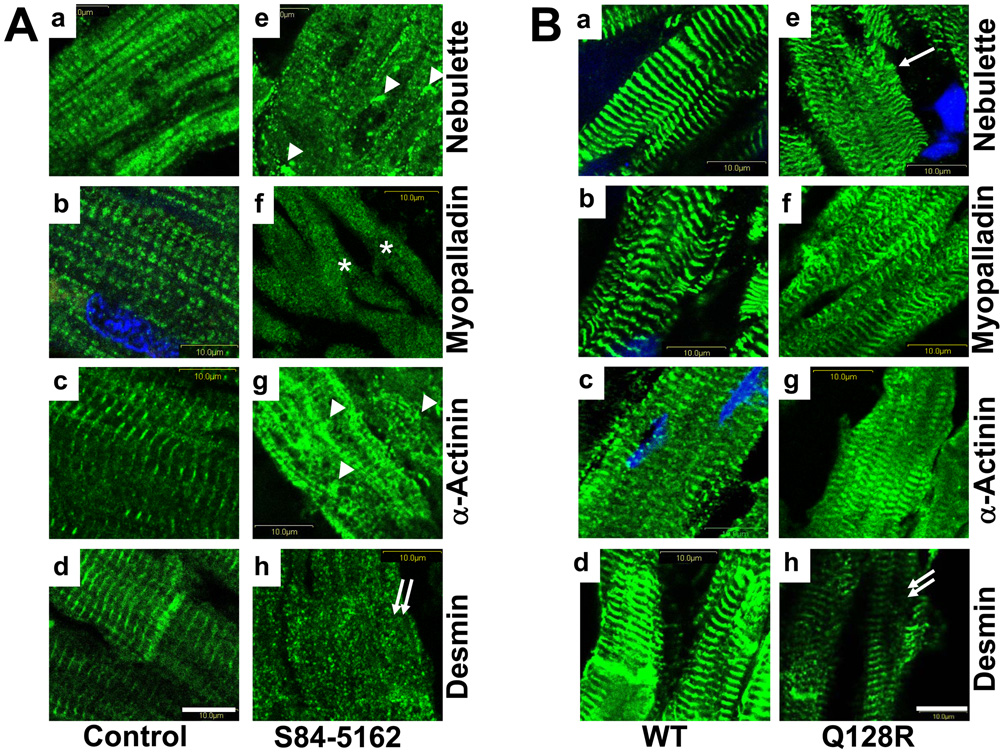
Figure 3. Comparative immunohistochemical analysis of human or mouse hearts.
Panels a–d are sections from human (A) or WT-Tg mouse (B) control hearts. Panels e–h are sections from the S84-5162 proband’ heart (A) or Q128R-Tg chimera heart (B), respectively. Nebulette (a, e); myopalladin (b, f); α- actinin2 in (c, g); and desmin (d, h) are shown in green, nuclei are blue (DAPI). Bar=10 µm.

