Figure 9.5.
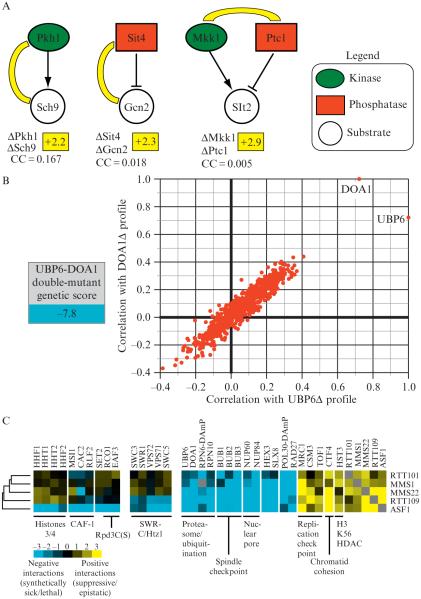
Quantitative genetic data reveals insight into functional pathways. (A) Individual genetic interactions identify enzyme–substrate relationships. An E-MAP focused on the regulation of phosphorylation in budding yeast (Fiedler et al., 2009) revealed positive genetic interactions between the kinase Pkh1 and it substrate, Sch9 (+2.2), between the phosphatase Sit4 and its substrate, Gcn2 (+2.3), and between a kinase (Mkk1) and a phosphatase (Ptc1) (+2.9) that acts on Slt2. The correlation of genetic interaction profiles between these pairs of genes is below the individual genetic interactions and was derived from the kinase E-MAP (Fiedler et al., 2009). (B) Functional connection between the deubiquitinase enzyme, Ubp6 and the ubiquitin chaperone, Doa1. A strain containing deletions in both UBP6 and DOA1 results in a strong negative genetic interaction (−7.8) and the genetic profiles generated from these deletions are highly correlated. (C) Using genetic interaction profiles to identify a pathway involved in genome integrity. Subsets of interactions (both negative and positive) for rtt101Δ, mms1Δ, mms22Δ, rtt109Δ, and asf1Δ are displayed. Some interactions are observed for all five deletions, interactions with the SWR complex are seen with only asf1Δ and rtt109Δ whereas only deletion of ASF1 result in negative interactions with histones H3/H4, the CAF complex, and factors involved in the Rpd3C(S) pathway (Set2, Eaf3, and Rco1).

