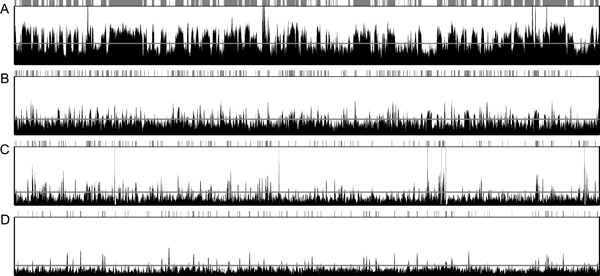
Figure 1.
CpG-score changes along the genomic coordinates. Genomic regions of 2-Mb were arbitrarily selected from the (A) ascidian (sea squirt) chr02q 3,857,310-5,857,309, (B) zebrafish chr1 21,198,157-23,198,156, (C) frog scaffold_1 4,936,533-6,936,532, and (D) human chr18 42,391,708-44,391,707. The horizontal lines crossing the graph are the barycenters of the two normal distributions (see Figure 3). Unmethylated regions are indicated by shaded tracts above the graph. Typical mosaic and global patterns are seen in the ascidian and human genomes, respectively.

