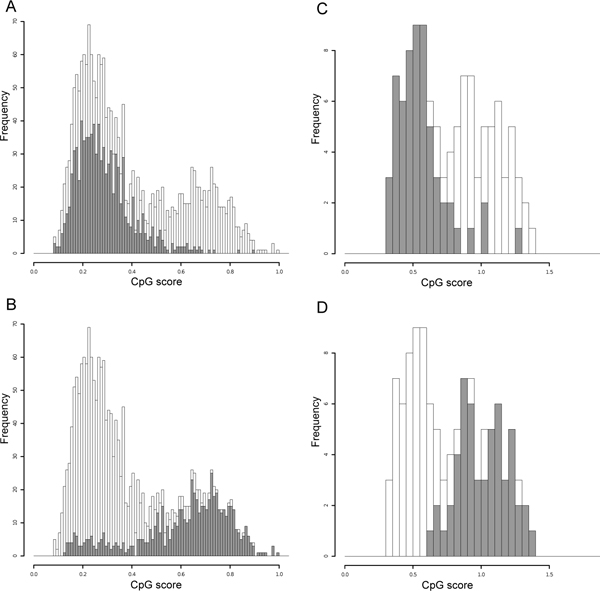
Figure 4.
Histograms showing the CpG-score frequencies in 2-kb genomic fragments obtained from experimental data for the DNA methylation levels of the human (A and B) and ascidian (C and D) genomes. The distributions of hypermethylated (A and C) and hypomethylated (B and D) fragments (gray) are shown with the whole data (white). In the human data, the right peaks are increased because of the preferential selection of CpG islands in the Human Epigenome Project.

