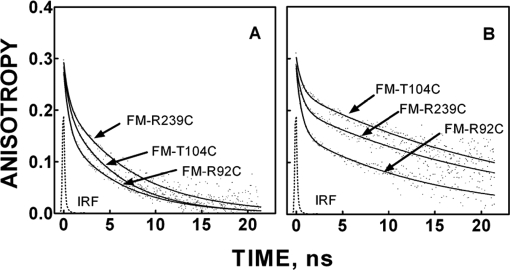
Fig. 4.
Time-resolved anisotropy decay of FM-R92C, FM-T104C, and FM-R239C RIα(91–244)·C-subunit free in solution (A) and complexed to C-subunit (B). The smooth line through each decay plot was generated with best fit parameters for a biexponential function (Equation 4). Measurements were made with the samples suspended in 50 mm MOPS, pH 7.0 with 50 mm NaCl, 1 mm DTT, 0.2 mm ATP, and 2 mm MgCl2 at 22 °C. IRF, instrument response function.

