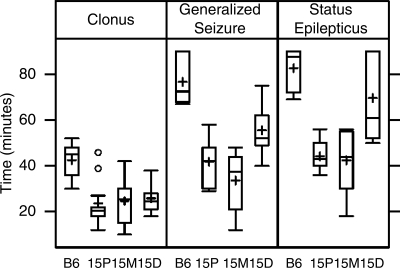
Fig. 3.
Box-plot of the distribution of kainic acid (KA) seizure endpoint responses in chr 15 congenic strains and B6-like littermate controls (n = 12 per group). The horizontal line inside each box represents the median response value, and the plus sign represents the mean response value. The top line and bottom line of each box represent the 75th percentile and 25th percentile, respectively. The line above extends to the largest value within 1.5 × IQR (interquartile range) of the 75th percentile, where IQR is the 75th percentile minus the 25th percentile, and the line below extends to the smallest observation within 1.5 × IQR of the 25th percentile. The 2 circles above the line on Clonus 15P are outliers that are >1.5 × IQR above the 75th percentile.

