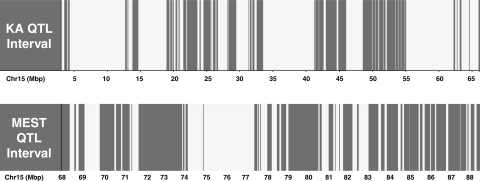
Fig. 5.
Haplotype block patterns for B6 and D2 mice in the KA (top) and MEST (bottom) quantitative trait locus (QTL) intervals on chr 15. White blocks are regions of the genome that are identical by descent between the strains. Gray blocks are regions that have higher polymorphism rate. Genomic location (in Mb) is shown on the x-axis.

