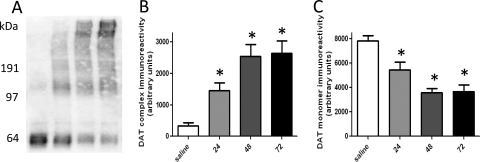
Fig. 1.
Time course of METH-induced DAT complex formation (A and B) and loss of DAT monomer immunoreactivity (A and C). Rats received four injections of METH (7.5 mg/kg s.c. per injection; 2-h intervals) or saline vehicle (1 mg/kg s.c. per injection; 2-h intervals) and were sacrificed 24, 48, or 72 h later. A, a representative blot of samples from saline-treated rats (lane 1) and METH-treated rats 24 h (lane 2), 48 h (lane 3), and 72 h (lane 4) after treatment. Molecular masses (kDa) are indicated adjacent to the representative blot. Columns represent the means and vertical lines indicate 1 S.E.M. determinations in 5 to 10 rats. *, values different from saline-treated controls (p ≤ 0.05).

