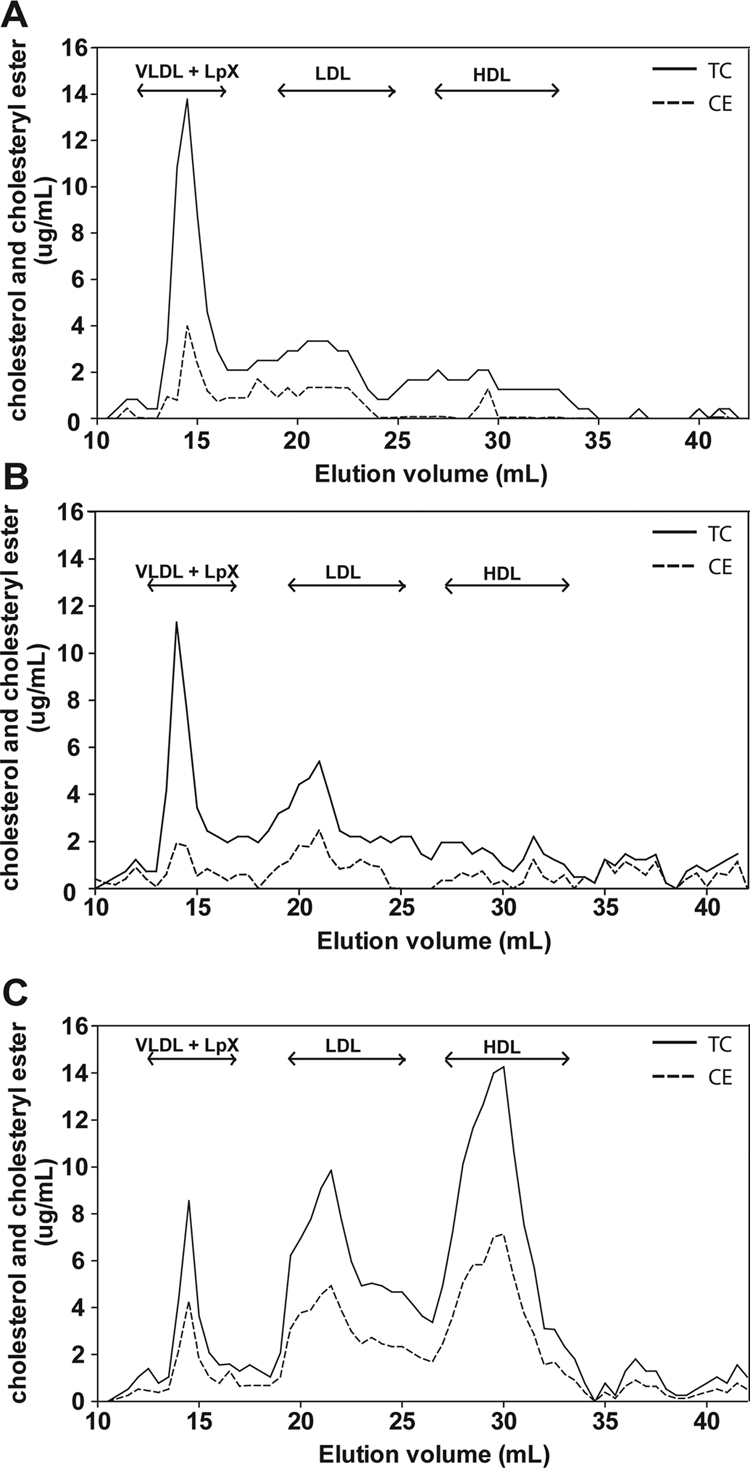
Fig. 2.

Lipoprotein profile of LCAT-KO mice infused hLCAT-Tg mice plasma. LCAT-KO mice were infused with plasma from LCAT-Tg mice, as described in Fig. 1. FPLC fractions from pooled plasma from untreated LCAT-KO mice (n = 5; A), heat-inactivated plasma-treated mice (n = 5; B), and fresh plasma-treated mice (n = 5; C) were analyzed for total cholesterol (solid line) and CE (dashed line).
