Fig. 6.

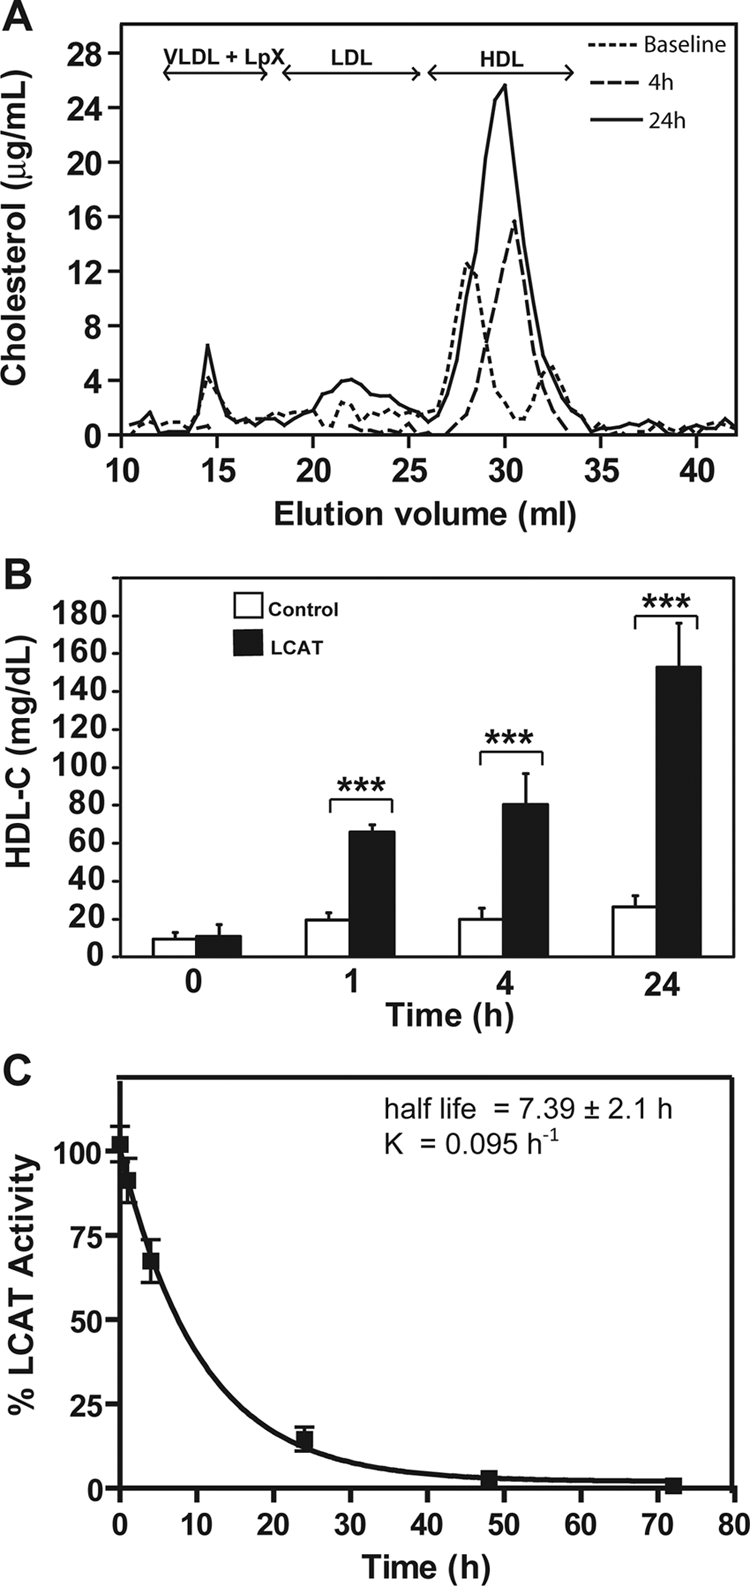
In vivo effect of rLCAT on lipoprotein profile of LCAT-KO × hapoA-I-Tg mice. rLCAT was injected (2900 units) intravenously into LCAT-KO/hapoA-I-Tg mice (n = 5). Pooled plasma at baseline (dotted line), 4 h (large dashed line), and 24 h (solid line) after rLCAT treatment was fractionated by FPLC and analyzed for total cholesterol (A). B, HDL-C was measured in plasma of control group (LCAT-KO mice, n = 5; injected with saline; open bars) and in LCAT group (injected with rLCAT; solid bars). C, LCAT activity was measured after intravenous rLCAT injection for the indicated times. Results are expressed as percentage of first time point (5 min) after treatment. Results are the mean ± 1 SD of five replicates. ***, p < 0.0001, experimental versus control group.
