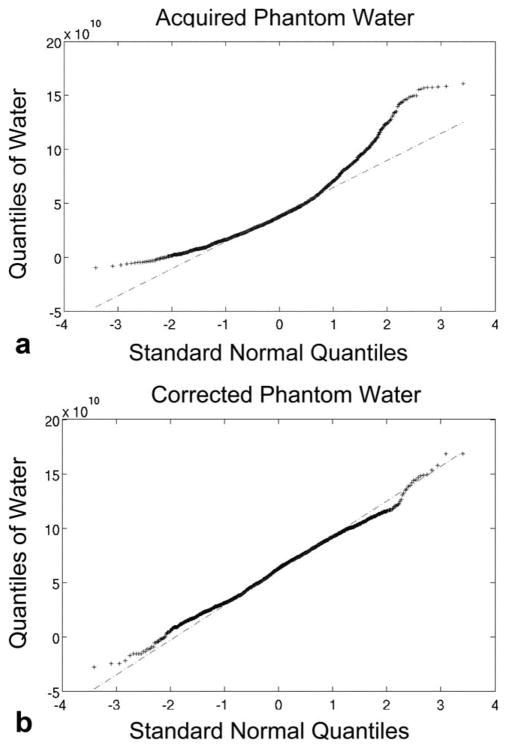
Figure 2.
Assessment of coil correction of water peak areas from a uniform phantom using Q-Q plots of the distribution of the phantom water peak areas as compared to a normal distribution. Data is from the voxels having more than 90% of maximum excitation (within the PRESS selected region and not under the VSS sat bands). a: Before correction. b: After correction. There is clearly variability in the acquired data that is not all normal in distribution. Once corrected, the MRSI data is more uniform, with the non-normal effects mostly eliminated, as demonstrated by the Q-Q plot better linear fit of the data to a normal distribution (R2 = 0.99 vs. 0.89).

