
Figure 1.
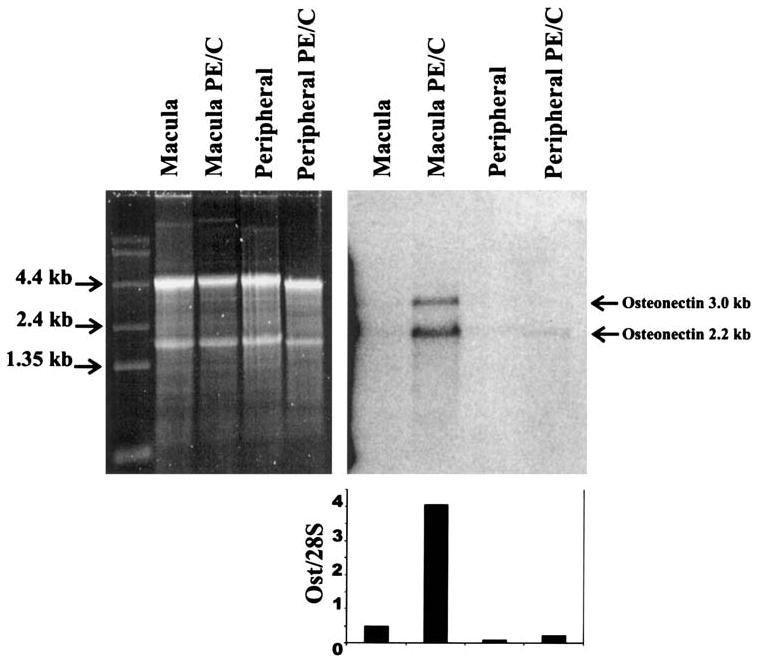
Expression of osteonectin/SPARC mRNA in monkey macula and peripheral retina by Northern blot analysis. Each lane was loaded with 5 μg of total RNA. Each sample represents a pool of 10 retinas. The left panel shows the SYBR Green II–stained gel, and the right panel is the blot probed with a 304-bp human osteonectin/SPARC probe generated with primers (CTGATGAGACAGAGGTGGTGGAAG and AAGAAGTGGCAGGAAGAGTCGAAG). The graph shows the relative levels of osteonectin/SPARC in the different tissues normalized to the 28S band as previously described.23 The 2.2-kb main osteonectin/SPARC band was used for quantification. Ost, osteonectin; PE/C, pigment epithelium/choroid.