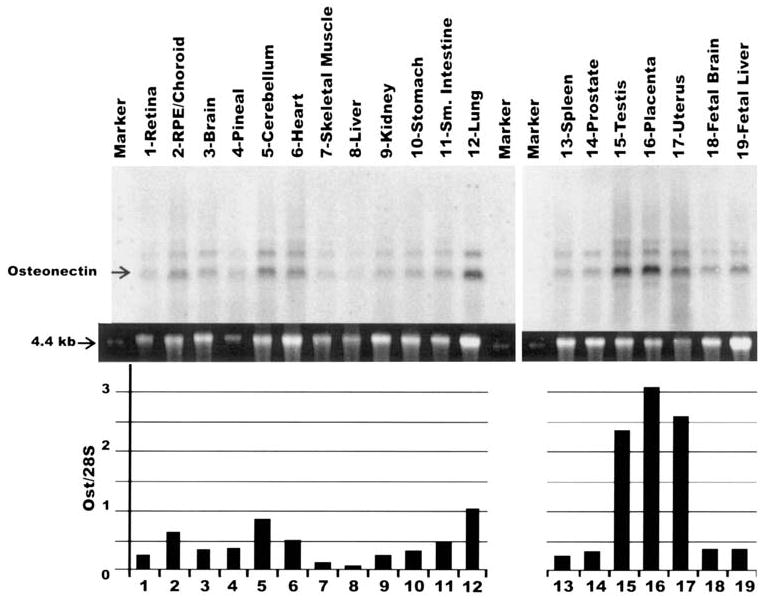
Figure 2.

Northern blot analysis to measure the expression of osteonectin/SPARC mRNA in human tissues. The lanes were loaded with 5 μg of total RNA. The gel, probe, and quantification conditions were identical to those used in Figure 1. The top panel shows the probed and exposed blot. The middle panel shows the 28S SYBR green II–stained band. The bottom graph shows the relative levels of osteonectin/SPARC expression in the different human tissues normalized to the 28S band. Ost, osteonectin.
