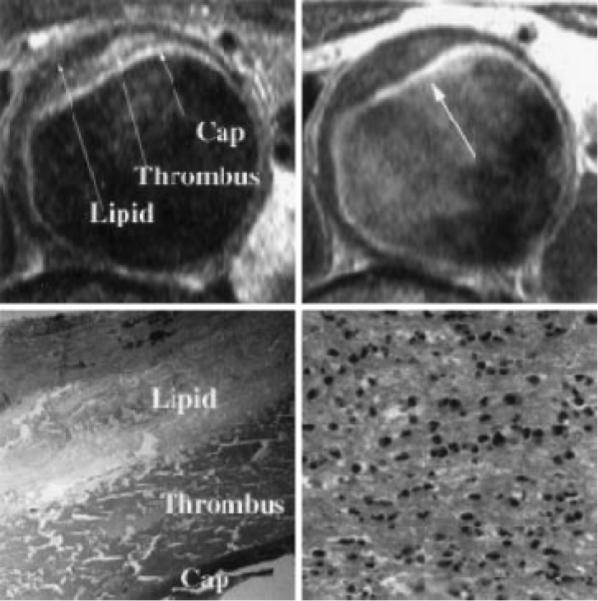
Figure 1.

Top left, T2-weighted MRI of AAA with 3 components visualized within plaque as marked. Top right, T1-weighted MRI after Gd-DTPA infusion with very high signal intensity seen in luminal layer, which was identified as fibrous cap by histopathology. Percent enhancement relative to pre–Gd-DTPA T1-W image was 143%. Bottom left, Histopathology showing fibrous cap, thrombus, and lipid corresponding to components visualized by MRI. Bottom right, High power of fibrous cap demonstrating dense infiltration of polymorphonuclear leukocytes (120 WBC/hpf).
