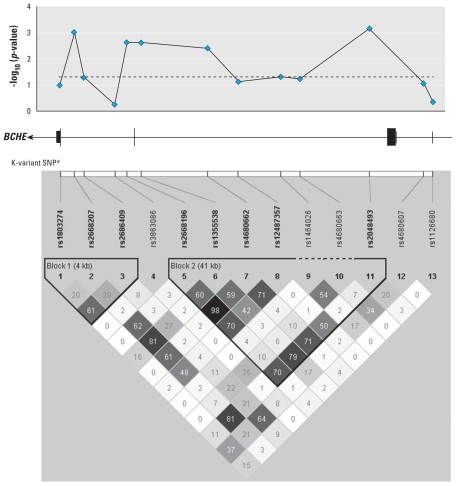
Figure 2.
Association data for the BCHE gene. (Top) The association of BCHE with cholinesterase activity (dominant model). (Middle) The genomic structure of BCHE, with exons indicated by vertical lines and boxes. (Bottom) The linkage disequilibrium LD pattern (r2 values are provided).
aThe K-variant (rs1803274), reported previously by Rubinstein et al. (1978), is at the 3′ end of the gene. Bold SNPs are located within haplotype blocks and have a minor allele frequency ≥ 0.05.

