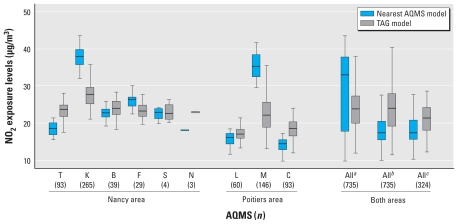
Figure 2.
Box plots (25th, 50th, and 75th percentiles) of NO2 exposure levels during the whole pregnancy as estimated by the nearest-AQMS model and by the TAG model, according to the AQMS closest to the residential address. The population was restricted to 735 women living < 5 km away from an AQMS without change of assigned station during pregnancy. Abbreviations: T, Tomblaine; K, Nancy-Kennedy; B, Nancy-Brabois; F, Fléville; S, St Nicolas de Port; N, Neuves-Maison; L, Les couronneries; M, Place du marché; C, Chasseneuil. Stations were located in the periurban area. K (Nancy) and M (Poitiers) are stations located in the city center.
aExposures estimated taking into account all AQMS. bExposures estimated taking into account all AQMS except K and M (city-center stations); for subjects initially assigned to one of these stations, the closest station has been replaced by the second AQMS nearest to the home address located outside the city center and < 5 km away from the home address, if any. cExposures were estimated taking into account all AQMS except K and M, with all women for whom K or M was the closest station excluded from the analysis.

