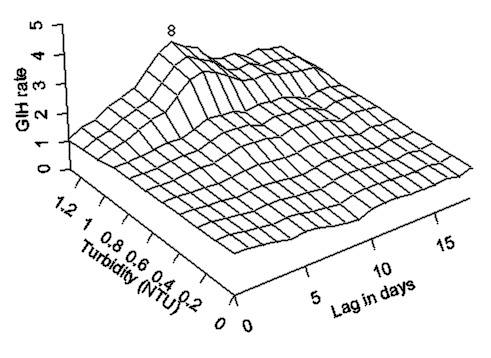
Figure 5.
The temporal exposure response surface plot of the lagged association between daily rate of gastroenteritis-related emergency room visits and hospitalizations in all adults in the south and central water supply area of Milwaukee, Wisconsin (per 100,000) and water turbidity (Nephelometric Turbidity Units) at the south plant.

