
Figure 3.
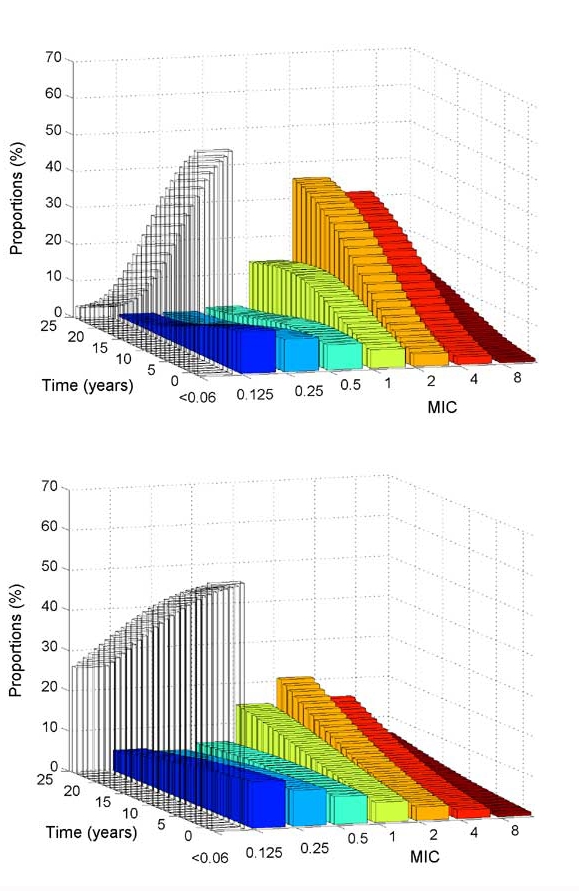
Simulated changes with time in the distribution of resistance levels in the meningococcal population, starting from a situation close to that of France in 2001, under (a) constant antibiotic treatment conditions (1 treatment/3 y) and (b) a frequency of treatment reduced by half (1 tretatment/6 y).