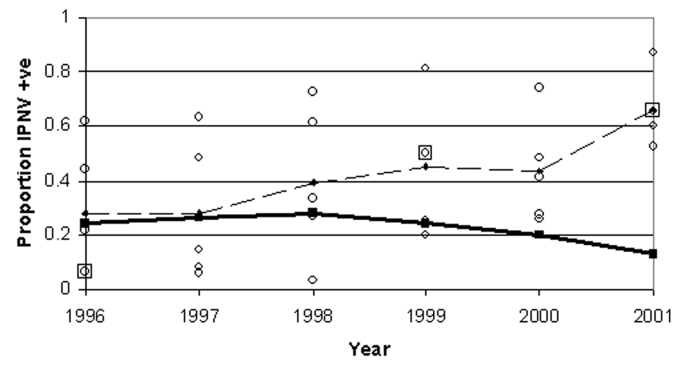
Figure 4.
Mean of regional annual mean prevalence of infectious pancreatic necrosis virus in marine salmon farms (thin dashed line) and standard deviation of regional annual means (thick solid line), by year. Individual marine regional annual means are shown by circles (where two circles overlay, a large square is added). Standard deviation has fallen at an increasing rate, in spite of increasing mean regional prevalence.

