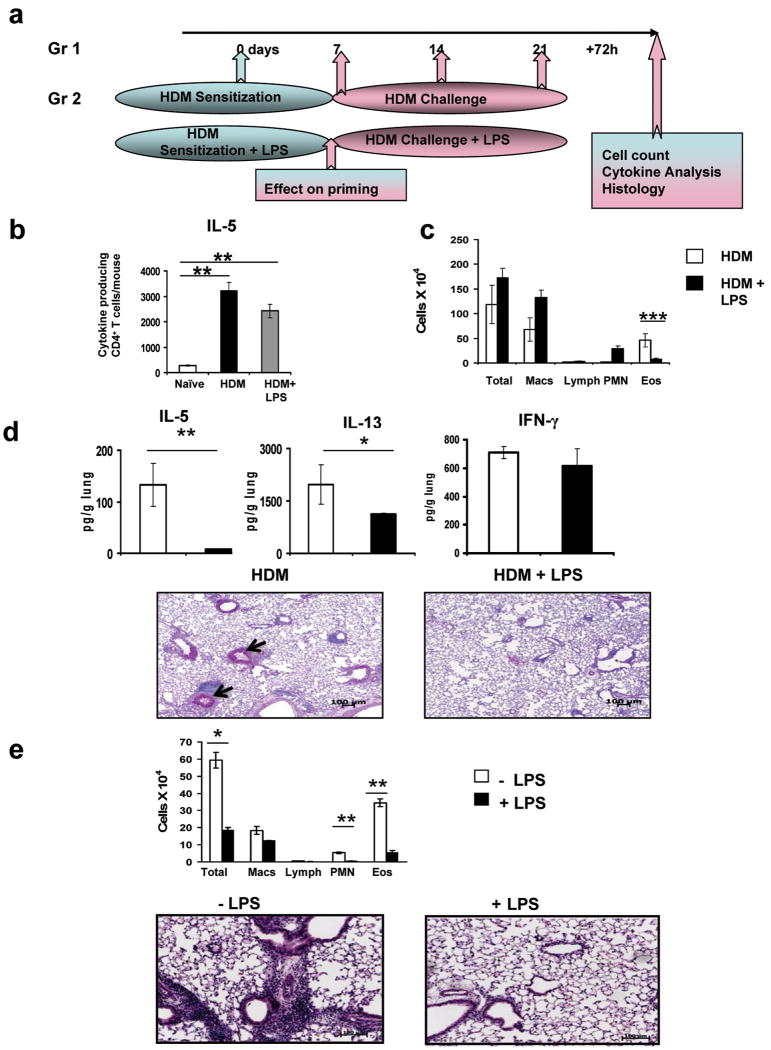
Figure 4.
Suppression of HDM- and TH2 cell-induced eosinophilic inflammation in the airways by LPS. (a) Diagram of the treatment protocol. HDM (100 μg per mouse) ± LPS (10 μg LPS per mouse) was administered intratracheally (i.t.) at the indicated time points. Lung-draining LNs were harvested from one group 7 days after one HDM instillation ± LPS to assess CD4+ T cell priming. The rest of the animals were challenged with HDM ± LPS and at 72 h after the final instillation, BAL fluid and lung tissue samples were obtained. (b) ELISPOT assay of cells harvested from lung-draining LNs. Naive mice were used as control. For all the groups, the total cell population was used for ELISPOT assay and the number of cytokine-expressing Th cells was estimated based upon the percentage of CD4+ T cells determined by flow cytometry. For the HDM and HDM+LPS groups, CD4+ T cells were also purified by magnetic bead selection prior to being subjected to the assay to confirm that the cytokines were being produced by CD4+ T cells. In all cases, cells were stimulated for 8-10 h with PMA (25 ng/ml) plus ionomycin (500 ng/ml). Results are expressed as the number of cytokine-producing cells per sample. Data shown are mean ± SD **, P <0.01. The data shown are representative of two independent experiments. (c) Counts of cells recovered in the BAL fluid. Values are mean + SEM ***, P<0.005. (d) The concentrations of IL-5, IL-13 and IFN-g in lung homogenates were measured by multiplex assay and are presented as mean ± SEM *, P<0.05 and **, P<0.01. Histological examination of lung sections stained with PAS for assessment of inflammation and mucus production. Lung infiltrates around bronchovascular bundles where eosinophilic response is most pronounced in disease were of +4 grade in animals that received HDM and +1/2 in those that received LPS together with HDM. Arrows indicate mucus staining. The data shown are representative of three independent experiments. (e) Th2 cells were generated in vitro using CD4+ T cells from DO11.10 mice and were injected i.v. into either LPS-treated mice or naïve recipient mice (5 × 10⁶ cells/mouse). The mice were then exposed to aerosolized OVA daily for 7 days and were analyzed 24 h after the last exposure. Total and differential counts of cells recovered in the BAL fluid (upper panel) and H&E staining of lung sections (lower panels) of both group of mice were performed. Values are mean ± SEM *, P<0.01 and
**, P<0.001. The data shown are representative of two independent experiments.

