
Fig. 3.
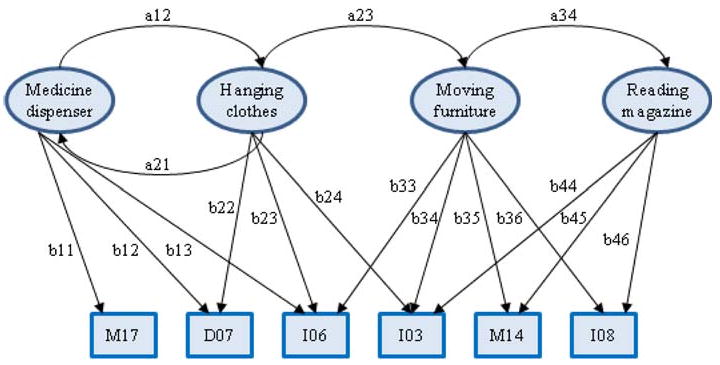
A section of an HMM for multi-resident activity data. The circles represent hidden states (i.e., activities) and the rectangles represent observable states. Values on horizontal edges represent transition probabilities and values on vertical edges represent the emission probability of the corresponding observed state