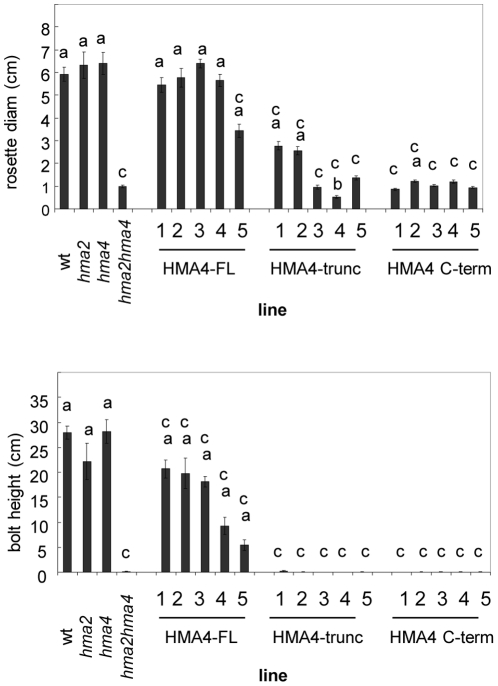
Figure 4. Rosette and bolt heights of lines expressing AtHMA4-FL, AtHMA4-trunc or AtHMA4-C-term.
Growth of AtHMA4-expressing hma2 hma4 plants (AtHMA4-FL, AtHMA4-trunc, AtHMA4-C-term) compared to untransformed hma2 hma4 controls. Wild-type (wt) and hma2 and hma4 mutants are also shown. Plants were grown on soil under identical conditions in controlled-environment growth room (22°C 16 h light, 20°C 8 h dark cycle).Top, Rosette diameter and bottom, bolt height (42 days). Values are means +/− S.E. from at least 24 plants). Student’s t-test was used to determine significance levels. a = significantly larger than hma2 hma4 (P<0.05), b = line significantly smaller than hma2 hma4 (P<0.05), c = line significantly smaller than wt (P<0.05).

