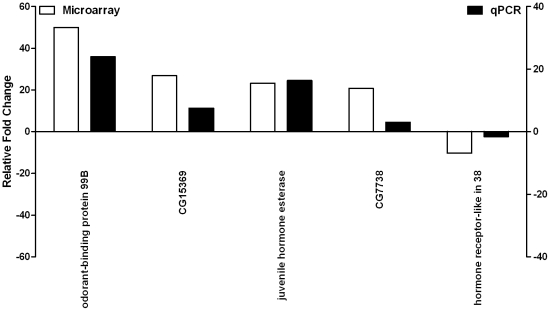
Figure 4. Validation of differential expression of five genes detected on WT profile by real time RT-PCR.
Five out of top 10 differentially expressed genes were amplified using cDNA from four independent RNA preparations and analyzed by qPCR. Graph shows concordant changes of gene expression levels for various genes noted on microarrays (unfilled bars) and validated by qPCR (filled bars).

