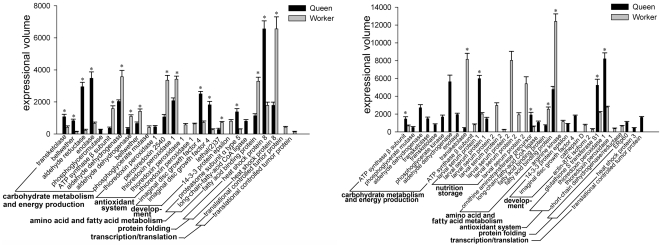
Figure 4. Comparison of protein expression levels in castes over 72 and 120 hours developmental stages, where the black bars denote the protein expression levels in queen larvae and grey bars denote the protein expression levels in worker larvae.
An asterisk at the top of the bars indicates the existence of statistically significant differences in the expressional level.

