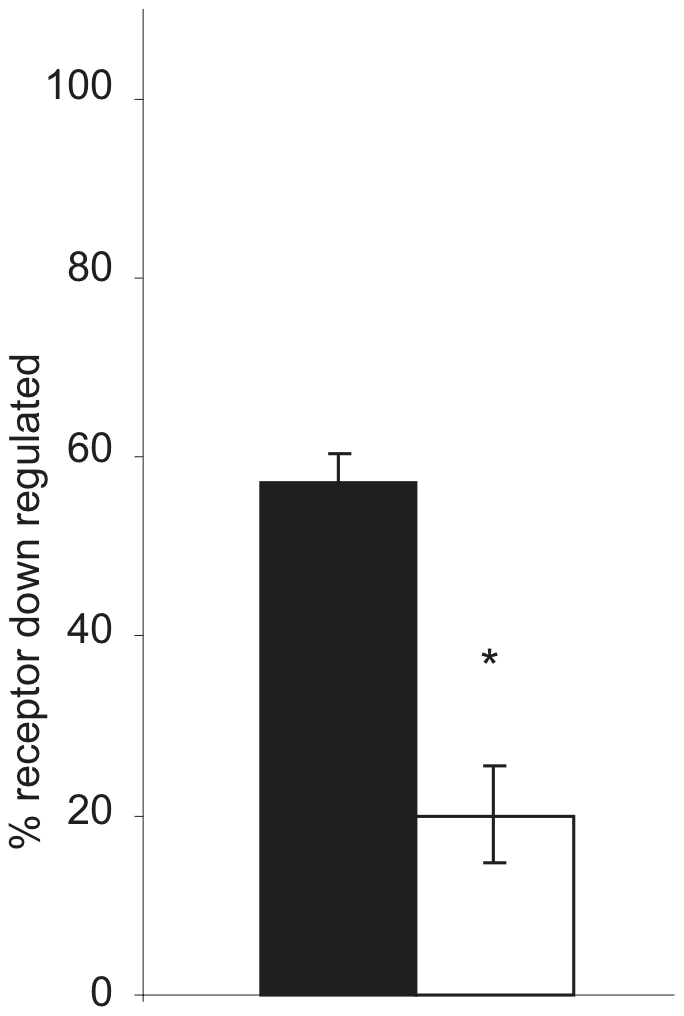
Figure 6. Effects of decreased RACK1 expression on M2 mAChR down regulation.

HEK cells stably expressing Flag-M2 with either normal levels of RACK1 (black bar) or with low levels of RACK1 (white bar) expression. Total receptors were measured by [3H]QNB binding following 8 hours of stimulation with 1 mM carbachol. Down regulation is expressed as percent of receptor down regulated compared to unstimulated cells. * indicates p<0.001.
