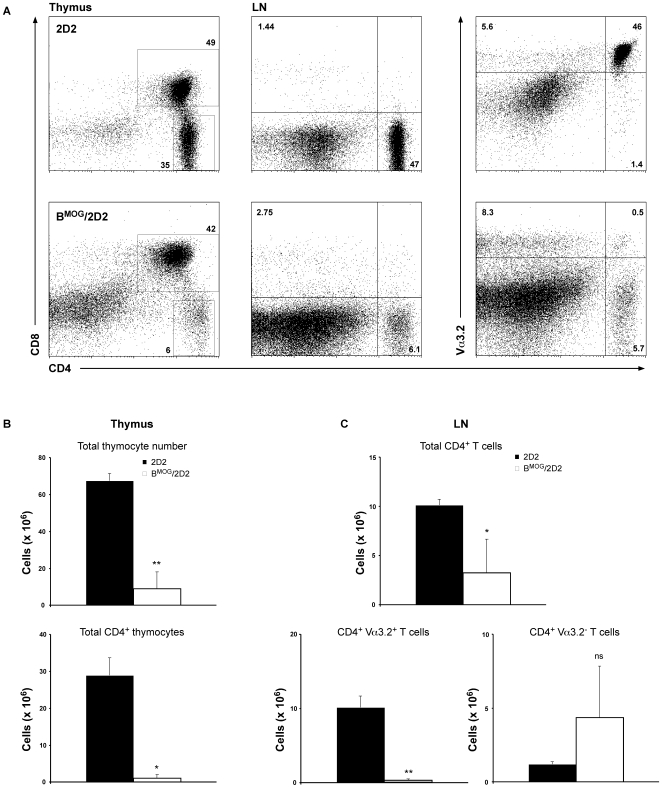
Figure 1. Deletion of 2D2 CD4+ T cells upon MOG encounter by B cells in the thymus.
Thymus and LN from WT 2D2 (upper row) and BMOG/2D2 (lower row) mice were analyzed by FACS analysis for presence of CD8+ and CD4+ Va3.2+ T cells, respectively (A). Genotypes and antibodies used are as indicated. Cell surface markers are shown as coordinates. Cells were gated on live lymphocytes. Numbers besides gates or in quadrants indicate percent positive cells in each. Total and CD4 single positive thymocyte numbers (B) and LN total CD4+ as well as CD4+ Va3.2+ and CD4+ Va3.2− T cell numbers (C) of 2D2 and BMOG/2D2 mice were calculated. Values represent mean ± SEM. ns, not significant.

