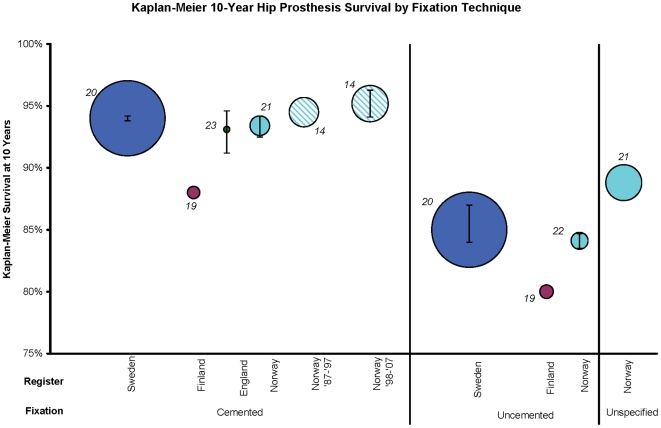
Figure 2. Kaplan-Meier ten-year hip prosthesis survival by fixation technique.
Kaplan-Meier ten-year estimates are presented, stratified by national register and fixation technique. Circle area is proportional to the sample size. Error bars represent 95% CIs. All estimates use revision for any reason as the endpoint. Cemented Norway and cemented England are single prosthesis studies, including only Charnley implants. The K-M 10 for uncemented THA in Norway is the weighted average of nine [21], [22] or ten [14] types of implant. All others are inclusive of all prosthesis brands. The Finnish K-M 10 data were estimated from K-M curves. Estimates are inclusive of all patient ages. 31% to 71% of the uncemented Norwegian sample, 87% of the English sample, and 100% of the remaining registers' samples were operated on for osteoarthritis. Each study reference is denoted next to the circle, representing the corresponding manuscript from which the Kaplan-Meier estimates were derived.

