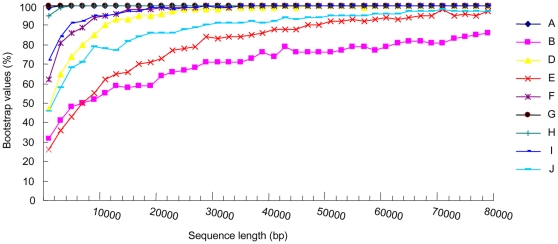
Figure 3. Plots of variable length variation of concatenated dataset and bootstrap values attained for nodes in the inferred simultaneous tree ( Figure 2 ) using variable length bootstrap.
Node C was not included due to moderate bootstrap values in the combined analyses.

