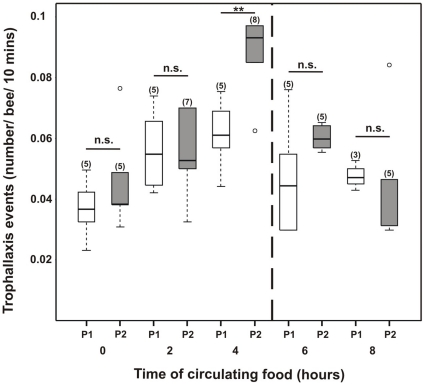
Figure 9. Trophallaxis events in relation to the presence of scent in the circulating nectar.
Number of trophallaxis events/bee/10 min of observation from the experimental colony while foragers collected 15% w/w sucrose solution in an artificial feeder placed near the colony for eight (8) hours. White boxes represent the reward program number 1 (P1) in which the colony collected unscented 15% w/w sucrose solution. Gray boxes represent the reward program number 2 (P2) in which bees fed for four (4) hours from a LIO-scented sucrose solution (15% w/w) and afterwards from an unscented solution of the same concentration. The number of observations is shown in parentheses. Boxes indicate the inter-quartile range, horizontal lines within boxes indicate the medians, whiskers include all points within 1.5 times the inter-quartiles, empty circles indicate outliers. The asterisks indicate statistical differences in a Mann- Whitney test (** p<0.01, n.s. not significant; for details see the text).

