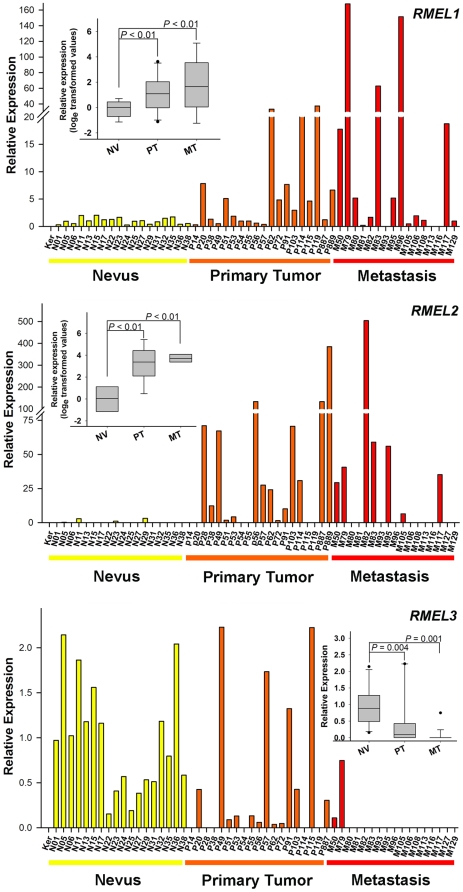
Figure 2. Expression profiles of RMEL1, 2 and 3 during melanoma progression.
Relative expression was calculated according to 2−ΔΔCT method, using TBP (Tata-box binding protein) as endogenous control and the mean value of the normalized Cts of all nevi samples as reference. cDNA samples derived from keratynocytes (Ker), nevi (N), primary melanoma tumors (P) and melanoma metastasis (M), from different patients (distinguished with a number following the letter N, P or M) were analyzed by Real-Time PCR. Statistical analyses were performed using ANOVA (after loge transformation of the data), for RMEL1 and RMEL2, or the Mann–Whitney test for RMEL3. Metastatic samples numbered 79, 81 and 105 are from lymph node metastasis; 50, 80, 93, 95, 96, 108, 113 and 127 from skin metastasis; 106 from lung metastasis and 82, 83, 116 and 129 from visceral metastasis.

