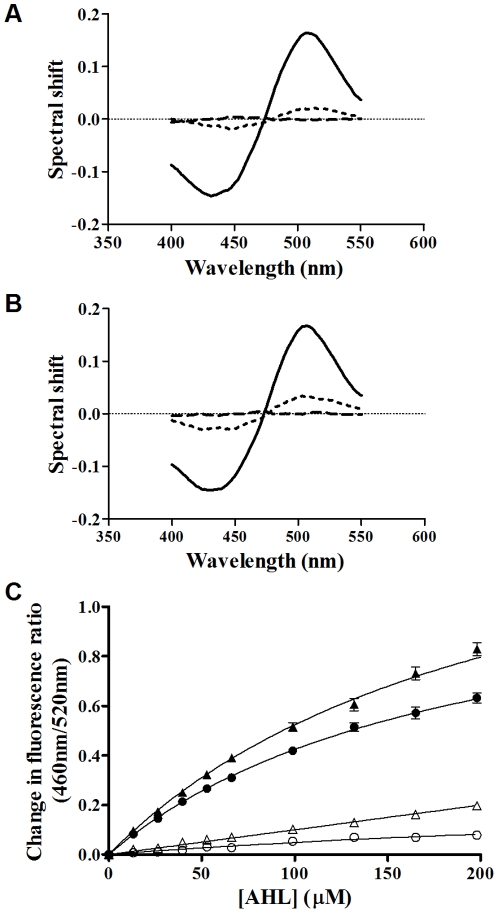
Figure 5. Comparing the interactions of COOH-3-oxo-C12 HSL and 3-oxo-C12 HSL with artificial membrane systems and their effects on membrane dipole potential.
Fluorescence difference spectra obtained by subtracting di-8-ANEPPS excitation spectra (λem = 590 nm) of PC(100%) [A] or PC(70%)Cholesterol(30%) [B] membrane vesicles (400 µM) from those obtained after these membranes were exposed to either 200 µM 3-oxo-C12-HSL (dotted line, n = 5) or 200 µM COOH-3-oxo-C12-HSL (solid black line). Before subtraction, each spectrum was normalized to the integrated areas so that the difference spectra would reflect only the spectral shifts. Each difference spectrum was then normalised to a DMSO control (dashed line). In all experiments the dye concentration was 10 µM and temperature was maintained at 37°C. [C] Binding profiles of 3-oxo-C12 HSL (▴,•) and COOH-3-oxo-C12 HSL (Δ,○) on titration to PC100% (circles) or PC70%Cholesterol30% (triangles) di-8-anepps labeled liposomes (400 µM) at 37°C normalised to DMSO controls. Profiles were fitted to simple hyperbolic and sigmoidal binding models (equations 1 and 2) and extra sum of squares F-Tests were used to determine the best fitting in each case (3-oxo-C12 HSL was hyperbolic while COOH-3-oxo-C12 HSL fit poorly to both models). All experiments n = 3±SEM.

