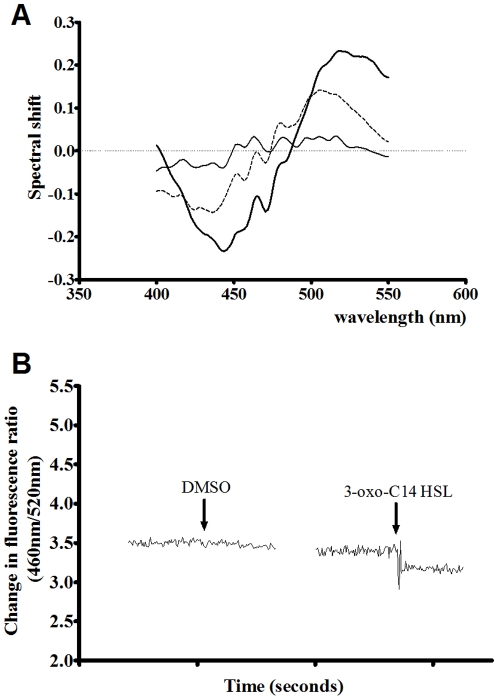
Figure 6. The interactions of AHLs with lymphocyte membranes perturbs the membrane dipole potential.
[A] Fluorescence difference spectra obtained by subtracting the di-8-ANEPPS excitation spectra (λem = 590 nm) of T Lymphocytes (40,000 cells/ml) from those obtained after cells were exposed to the following QS molecules 3-oxo-C14-HSL (thick line), 3-oxo-C12-HSL (dashed line) and 3-oxo-C10-HSL (thin line). Before subtraction, each spectrum was normalised to the integrated areas so that the difference spectra would reflect only the spectral shifts before each difference spectra was normalised to a DMSO control (not shown). A three point moving average was then applied to reduce noise. [B] A dual wavelength ratiometric measurement of the dipole potential variation in di-8-ANEPPS. In this example additions of 22 µM 3-oxo-C14-HSL or equivalent volumes of DMSO were made to T-Lymphocytes (40,000 cells/ml) labeled with 10 µM di-8-ANEPPS. Samples were excited at 460 nm and 520 nm. The fluorescence was read at 590 nm and the ratio R(460/520) was calculated (shown). All experiments n = 3.

