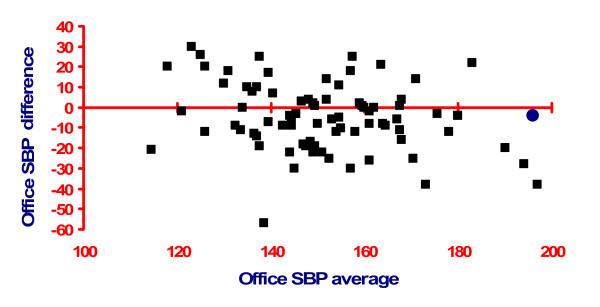
Figure 1.
Variability of systolic blood pressure (BP) on repeated measurement (research study conditions) taken from [16]with permission (Padfield PL: Self-monitored blood pressure: a role in clinical practice? Blood Press Monit 2002, 7(1):41-44.) A Bland Altman plot relating the average of two separate BP readings, taken 2 weeks apart (x-axis), against the difference between those two readings (y-axis) in 85 subjects where there were no treatment changes between readings. Note the mean similarity between the two occasions (blue circle) but the enormous individual variability.

