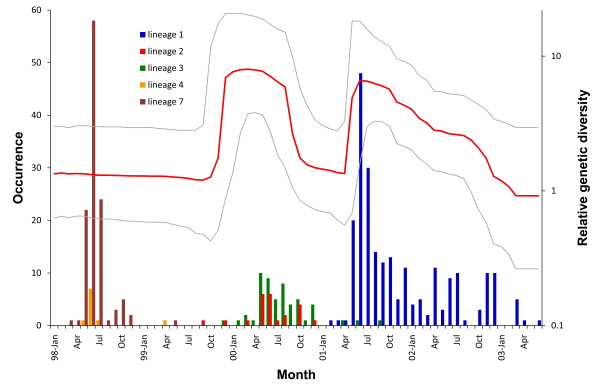
Figure 1.
Occurrences (left y-axis) and temporal changes in the relative genetic diversity (right y-axis) of major enterovirus (EV) 71 lineages each month. Occurrences of major lineages, lineages 1~4 (EV71-B4) and lineage 7 (EV71-C2), are shown as a bar plot. The lines represent median (red line) and 95% highest posterior densities (HPDs; gray line) of the Bayesian skyline plot derived from VP1 of lineages 1~3.

