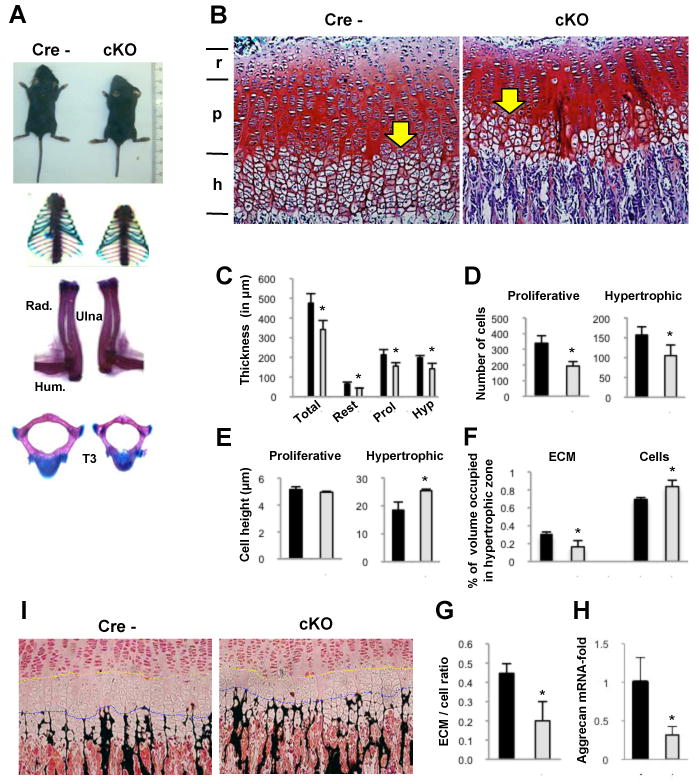
Figure 2. Deleting Zfp521 in chondrocytes alters growth plate structure and skeletal development.

(A) Two-week-old Zfp521 cKO mice (right) exhibited postnatal dwarfism. Rib cage, long bones and vertebrae of the Zfp521 cKO mice were smaller than in the floxed control.
(B) Proximal tibia growth plates from 2 week-old mice were stained with Safranin O (10×). A reduction in the thickness of all layers was observed in the Zfp521 cKO growth plates (r, resting; p, proliferative; h, hypertrophic). In addition, the hypertrophic zone was closer to the epiphysis (yellow arrow) suggesting early hypertrophic differentiation.
(C-H) Data derived from Zfp521 cKO mice are shown in white and data obtained in floxed control mice are presented in black (C) Histomorphometric analysis of proximal tibia growth plates from the Zfp521 cKO and floxed control mice confirmed an approximate 30% reduction in the thickness of all layers. Also, there were fewer cell columns with fewer cells per column in the proliferative zone (339±48 vs 193±28) and a reduced cell population in the hypertrophic zone (157±21 vs 105±27) (D). (E) The cell height of hypertrophic chondrocytes in Zfp521 cKO growth plates was increased (17.7±2.7μm vs 23.7±2.9μm), whereas proliferative chondrocytes were similar in floxed control and mutant growth plates. (F) The percentage of the hypertrophic zone volume occupied by extracellular matrix (ECM) was reduced in mutant growth plates (31±0.02% vs 16±0.07%) a comparable increase in the percentage occupied by cells (69±0.02% vs 84±0.07%), which generated a decrease in the ECM/cell ratio (0.44±0.05 vs 0.20±0.07) (G). (H) The expression of aggrecan mRNA is reduced by about 50% in the growth plate of Zfp521 cKO mice.
(I) Von Kossa staining showed earlier chondroid mineralization (black) in the Zfp521 cKO growth plates. Note the reduction in the number of layers of hypertrophic chondrocytes between the pre-hypertrophic chondrocytes and the leading edge of the mineralization front (yellow and blue lines). Data are means ± S.D., n=4, P<0.05.
