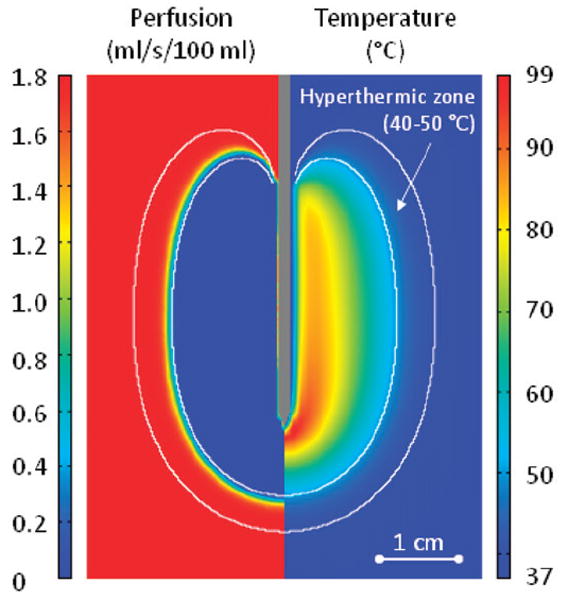
Figure 5.

Section of tumour tissue with RF electrode inserted into the centre. The left side of the figure displays perfusion [mL/s/100 mL], the right side the temperature [°C] – both after a 12-min ablation. Perfusion and temperature are used as input data to determine drug release from LTSL. The white lines indicate the hyperthermic zone (40–50°C) where the combination of DOX+heat can kill cells not destroyed by heat alone.
