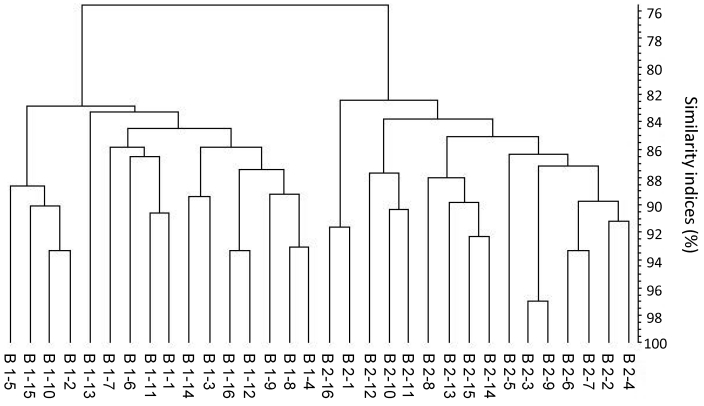
Figure 5.
Dendrogram based on DGGE profiles representing 16S rRNA gene-derived amplicons of cecal samples collected from C57BL6 mice originating from 2 breeding centers (B1 and B2). Each figure within the groups indicates a sample from a single mouse (numbered from 1 to 16). The scale bar represents the similarity index as a percentage (an index of 100% indicates complete similarity). The overall similarity is 75.6% ± 4.6%; that for animals from B1 is 82.8% ± 3.1%, that for B2 is 82.5.0% ± 4.2%.

