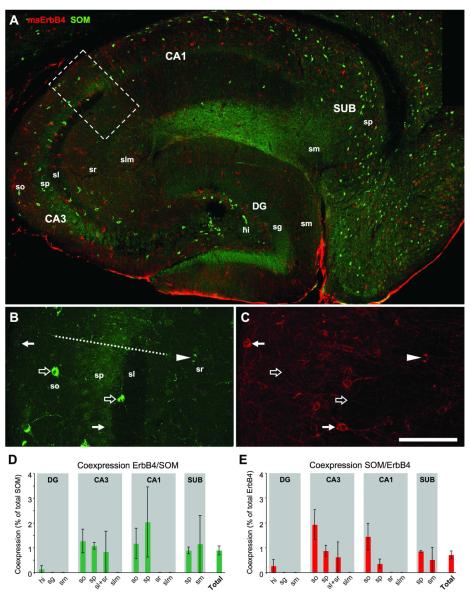
Figure 4. SOM cells do not express ErbB4.
(A) The distribution of SOM-immunoreactive somata is similar to PV cells; they are mostly confined to layers so, sp, and hi. In CA3 close to DG, however, SOM cells are also frequently found in sr. Note the dense fiber plexus in slm of CA1 that is the terminal field of O-LM cell projections. Single channel images (B-C) show that most somata are immunoreactive for either SOM (open arrows) or ErbB4 (arrows); however, one cell in sr coexpresses both markers (arrowhead). The quantitative analysis (n=3) reveals that the maximum coexpression is 2% in both SOM cells (D) and ErbB4 cells (E). The overall frequency of coexpression in the entire hippocampus is below 1% for both cell populations (“Total” in D-E). Abbreviations: see Fig.2. Scale bar = 290μm (A), 100μm (B,C).

