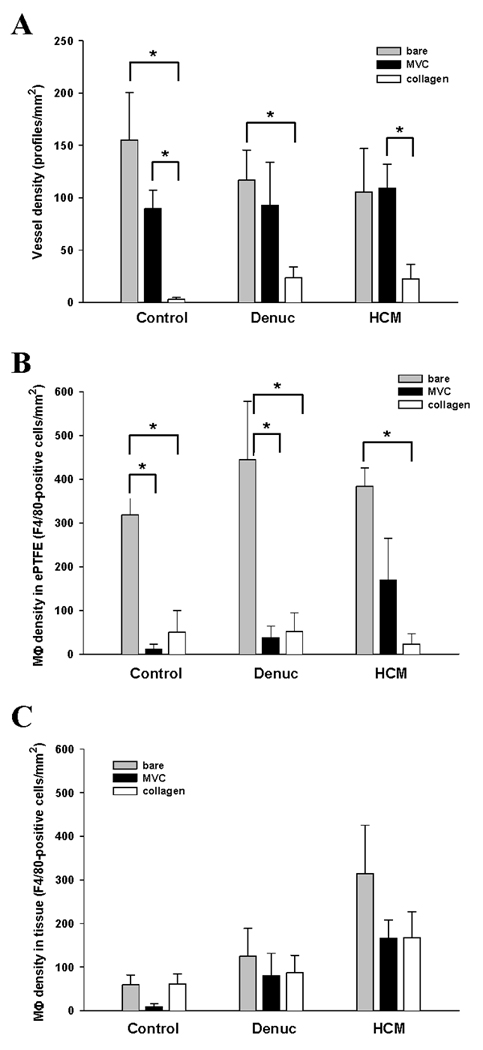
Figure 4.

Vessel densities (A) were measured by counting the GS1-positive profiles located within the first 100 microns of peri-implant tissue in paraffin sections (n ≥ 3 different implants). Similarly, activated macrophage densities were determined by counting F4/80-positive cells within the interstices of the ePTFE (B) and the peri-implant tissue (C) in paraffin sections (n ≥ 3 different implants). Values represent mean ± s.e.m; * p <0.05.
