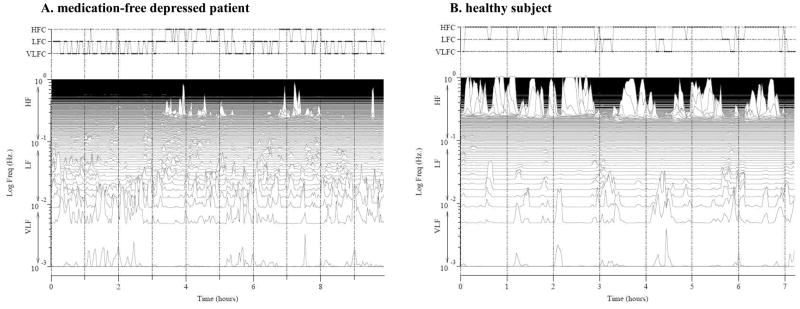
Figure 1.
A comparison of ECG-derived sleep spectrograms from a healthy control subject and a patient with depression. Left panel: A 34-year-old depressed female; high-frequency coupling (stable sleep): 21%; low-frequency coupling (unstable sleep): 46%; and very-low-frequency coupling (REM/wakefulness): 28%. Right panel: A 30-year-old healthy female; high-frequency coupling: 76%; low-frequency coupling: 13%; and very-low-frequency coupling: 12%. The spectrographic profiles of the two subjects are visually distinguishable: the depressed individual has fragmented sleep states whereas the healthy subject has more continuous high-frequency coupling sleep.

