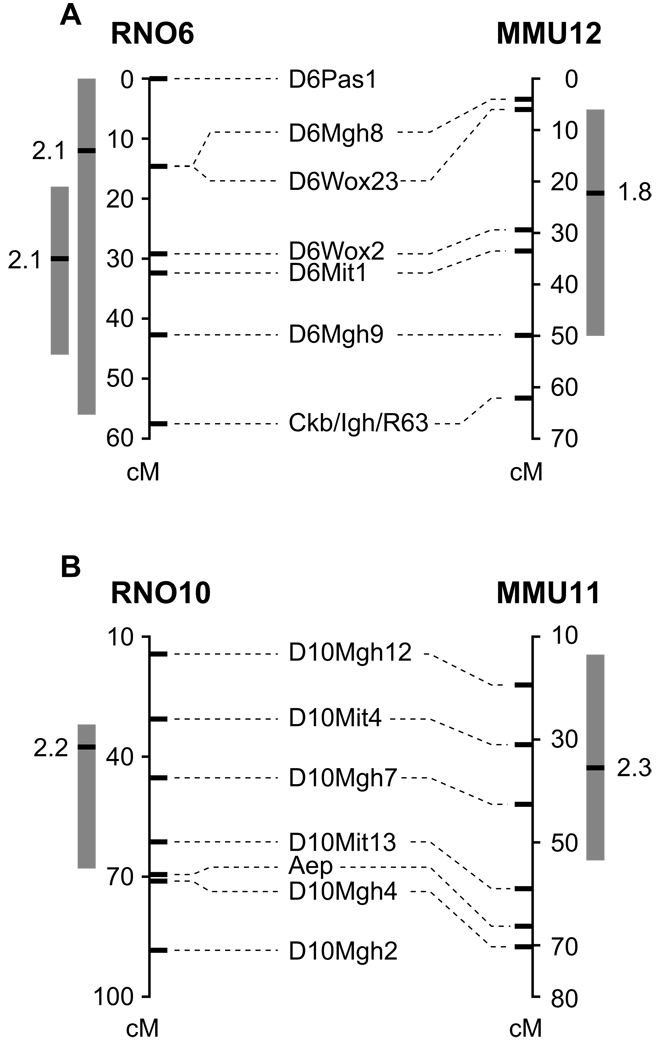
Figure 2.
Rat-mouse concordance between cholesterol QTL on two different chromosomes. Genetic maps for rat chromosomes are shown on the left and for mouse chromosomes on the right. Rat markers names are shown in alignment with their genetic positions on the rat genome, and with their homologous positions on the mouse genome. The grey boxes show the original (pre-combination) QTL confidence interval for each species; the black bar represents the QTL peak. The LOD score for each QTL is shown adjacent to the peak. (A) Rat WxDA chr 6 male (most left) and female QTL are aligned with mouse BxD2 Chr 12 QTL. The most proximal rat marker (D6Pas1) is homologous to mouse Chr 17. The remaining markers align to mouse chromosome 12 contiguously. The female rat data was not chosen for this combination as the rat peak positions are not within the rat/mouse overlapping regions. (B) Rat WxDA Chr 10 female QTL is aligned with the mouse PxD2 Chr 11 female QTL. The region immediately surrounding the most distal rat marker, D10Mgh2, is not homologous to the mouse genome; the other markers align to mouse Chr 11 contiguously.

