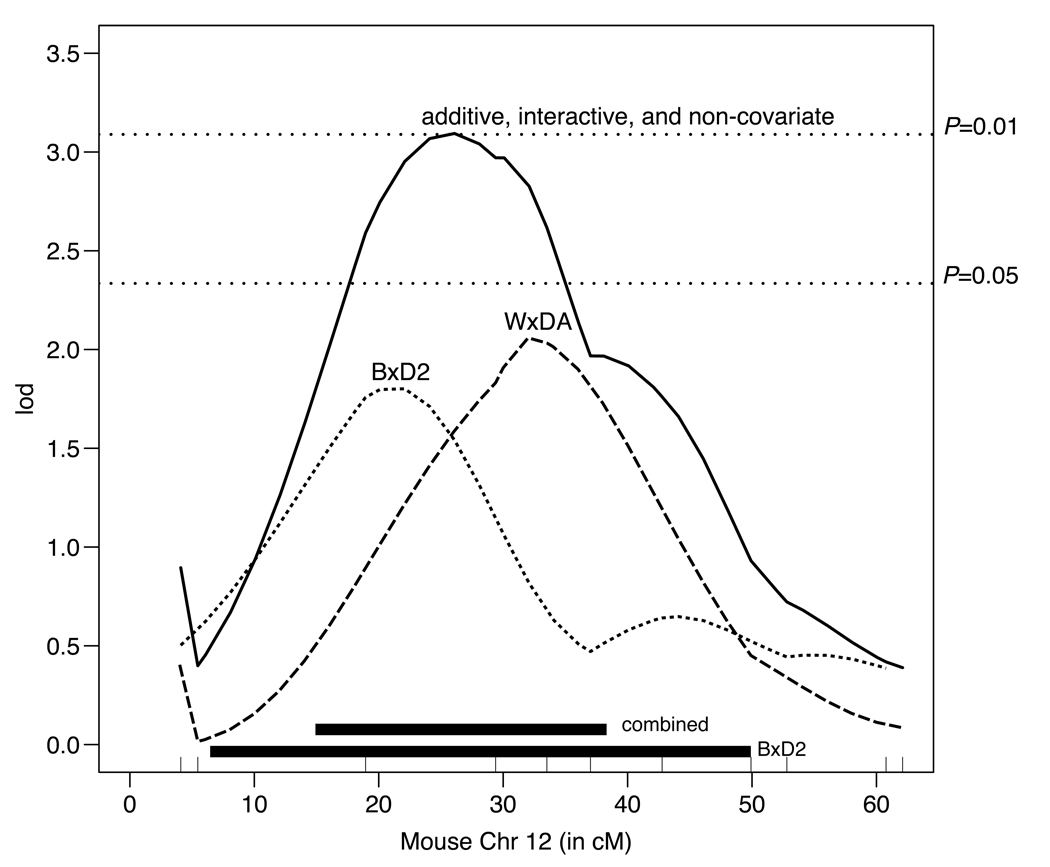
Figure 3.
Combining rat chromosome 6 data with mouse chromosome 12 data. All cM positions are with respect to mouse chromosome 12. Confidence intervals for the original and species-additive QTL are depicted by the black boxes; the box closest to the bottom represents the original 95% confidence interval in the mouse. The interactive and additive plots are indistinguishable, suggesting the QTL is caused by the same gene in both the rat and the mouse.

