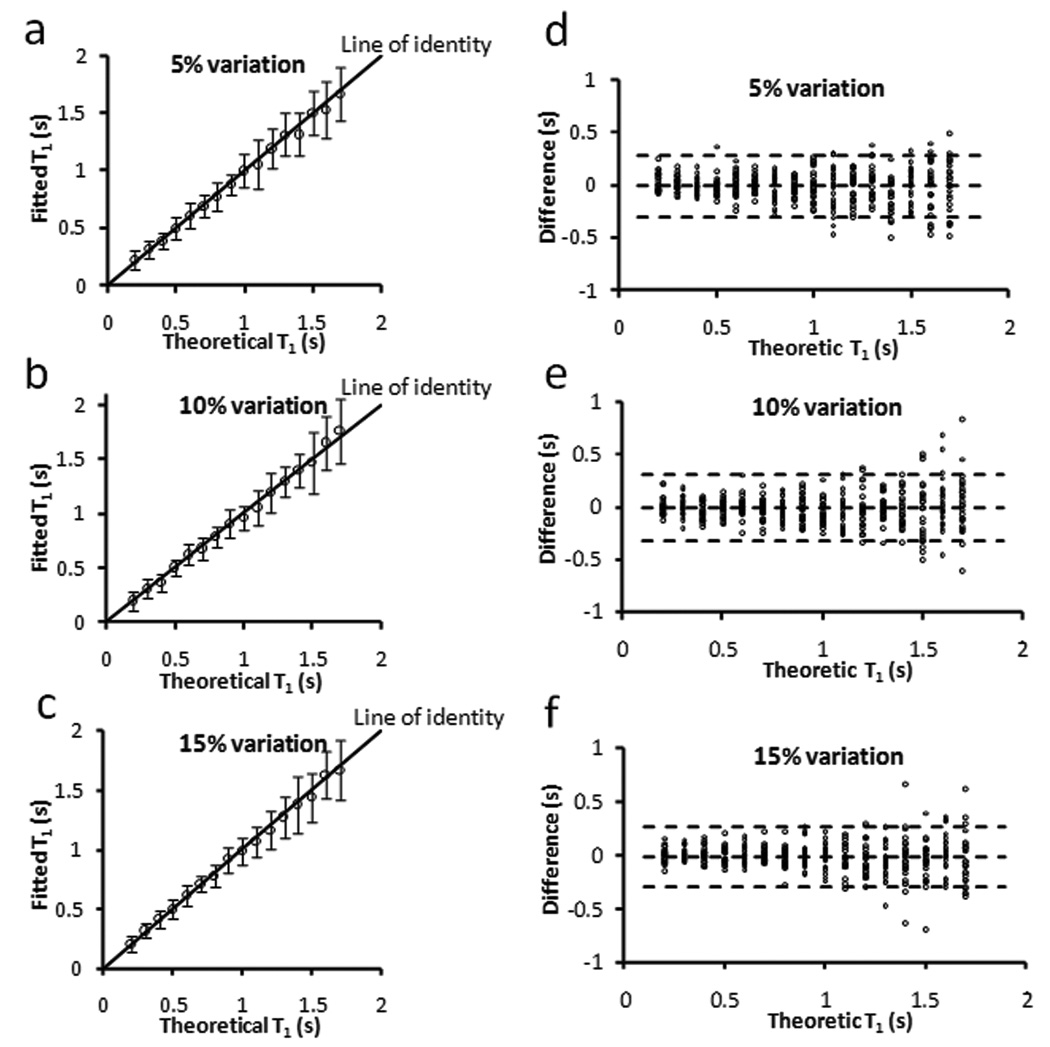
Figure 3.
Simulation of the effect of τ fluctuation on T1 estimation with TR = 2.4 s and τ = 0.24 s. a–c. Fitted T1 versus theoretical T1. The error bar is the standard deviation from 25 simulation runs. d–f. Bland-Altman plots of the difference between fitted T1 and theoretical T1. The middle dotted line is the mean of the difference. The upper and bottom dotted lines are the mean plus and minus two times of the standard deviation, respectively.

