
Fig. 3.
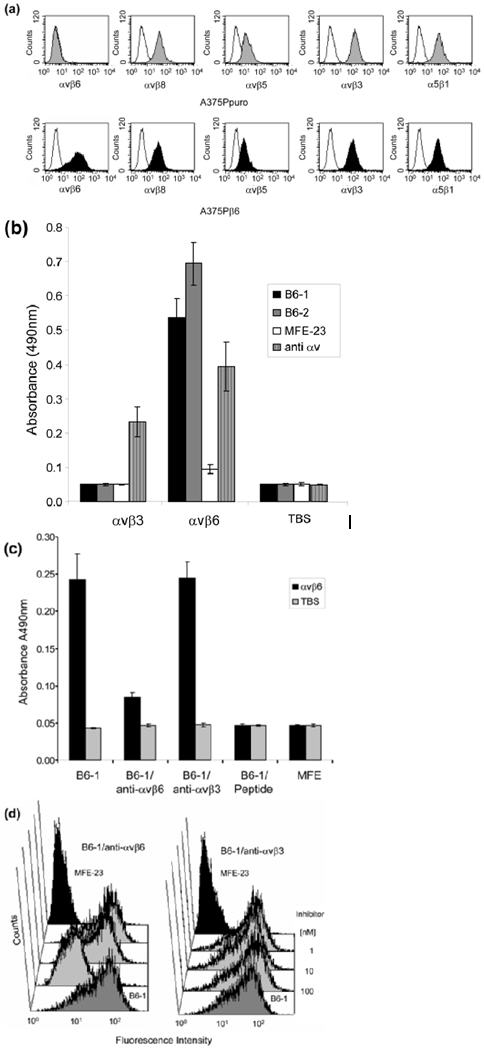
Specificity of B6-1 for αvβ6. (a) Flow cytometry analyses show that B6-1 did not bind to A375Ppuro cells even though they express the RGD-directed integrins αvβ8, αvβ5, αvβ3 and α5β1 as detected by the same anti-integrin antibodies, in the same conditions, on both cell lines. Negative controls (white histograms) were incubated with Alexa Fluor 488®-conjugated goat anti-mouse IgG only. (b) Graph showing that B6-1 did bind to immobilized αvβ6 and not to αvβ3 in ELISA. MFE-23 did not bind to either of these integrins. Binding of B6-1, B6-2 and MFE-23 (all at 5 μg/ml) to immobilized αvβ3 or αvβ6 wells was detected with rabbit anti-MFE-23 IgG followed by goat HRP-labeled anti-rabbit IgG antibodies. Wells were also incubated with mouse anti-αv, followed by sheep HRP-labeled anti-mouse IgG, to detect whether the integrin was immobilized,. (c) Graph showing that binding of B6-1 [50 ng/ml, 1.75 nM] to immobilized αvβ6 was inhibited by anti-αvβ6 (at 100 nM) and by the 20-mer VP1 peptide24 (at 100 nM) but not by a function-blocking anti-αvβ3 antibody (at 100 nM). B6-1 and MFE-23 used on its own were included as positive and negative controls, respectively. Binding was detected as described in Fig. 2a. (d) Flow cytometry demonstrates that binding of B6-1 (at 500 ng/ml, 17.5 nM) to αvβ6-expressing A375Pβ6 cells was inhibited by anti-αvβ6 antibody (at 100 nM) (left panel, second trace from front), whereas the same concentration of anti-αvβ3 had no effect (right panel, second trace from front). B6-1 (left and right panels, first traces from front) and MFE-23 (left and right panels, last traces), both at 500 ng/ml, were included as positive and negative controls, respectively. Binding was revealed with rabbit anti-MFE-23 IgG followed by R-PE-labeled goat anti rabbit IgG. The data represent the mean of triplicate measurements and error bars represent the standard deviation at each data point (b and c).