
Figure 10.
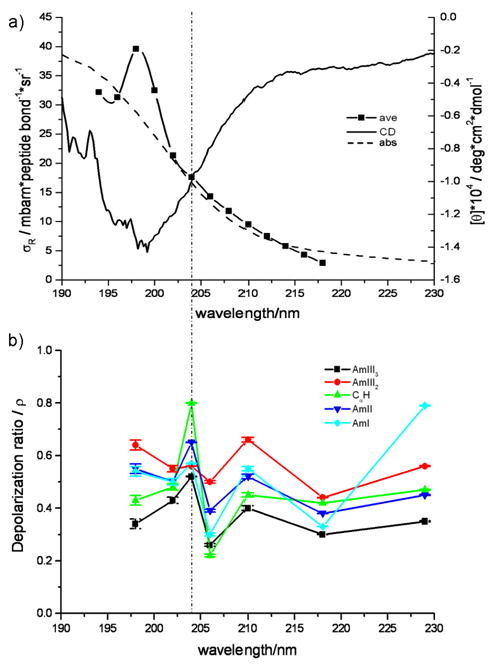
(a) The average amide band excitation profile for the PPII-like conformation, excluding the AmI vibration; CD spectrum of AP at 60° C; and absorption spectrum of AP at 60° C. (b) Raman depolarization ratios of AP at 60° C. The dashed line indicates the presence of the shoulder in the excitation profile.