Figure 1.
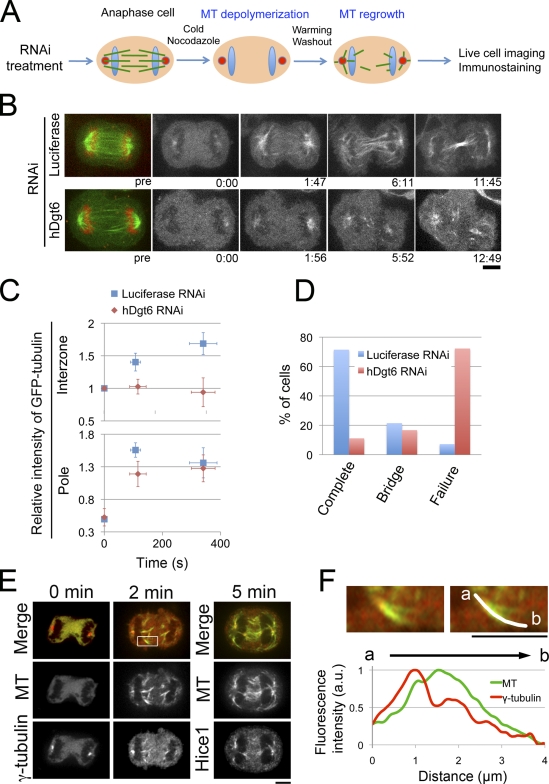
Functional central spindle formation by augmin-dependent de novo MT generation in anaphase. (A) Schematic representation of the MT depolymerization/regrowth assay in anaphase cells. (B) GFP-tubulin–expressing cells treated with control (luciferase) or hDgt6 siRNA in the assay. The initial time point of observation is represented as 0:00 (min:s), which is ∼60 s after nocodazole was washed out. (C) Relative fluorescence intensity of GFP-tubulin in the interzone and the polar region of control (n = 14) and augmin-depleted cells (n = 18) in the assay. Means ± SEM (y axis) or SD (x axis) of single cells from six independent experiments are shown. (D) Completion or failure of cytokinesis after the assay in control (n = 14) and augmin-depleted cells (n = 18). Means of single cells from six independent experiments are shown. Bridge indicates the percentage of cells that possess an intercellular bridge at the end of the observation period. (E) Immunostaining of MT (green), γ-tubulin (red at 0 and 2 min), and Hice1 (red at 5 min) in anaphase cells during the MT regrowth phase. MT regrowth began at time 0. (F, top) A magnified image of the region indicated in the box in E. (bottom) MT and γ-tubulin intensities along an MT bundle. Chromosomes are located at the left. Bars, 5 µm.

